Complete the Prerequisites before starting this workshop.
Using an AI assistant?
Paste the TraceCtrl agent instructions into Claude Code, Cursor, or Copilot to get contextual help throughout this workshop.
Part 1: Introduction to TraceCtrl
What is TraceCtrl?
TraceCtrl is a security observability platform for agentic AI. Our tagline captures the workflow:- See — Visualize your agent’s architecture, topology, and risk posture at a glance
- Trace — Trace every message, tool call, and model request through the full execution lifecycle
- Ctrl — Control and harden your agent’s configuration with automated scanning and remediation
Components
TraceCtrl has five components:Architecture

How data flows
How data flows
- Your agent (or OpenClaw) exports OpenTelemetry spans to the OTel Collector.
- The Collector writes spans to ClickHouse (column-oriented database optimized for traces).
- The Engine runs a pipeline every 60 seconds — reads spans, builds agent inventory, discovers topology edges, ingests guardrail registrations and violations, and computes the attack graph.
- The Dashboard queries the Engine API to render Sessions, Topology, Alerts, Guardrails, Scan reports, Risk, and Attack Paths.
- Guardrails ride the same pipe: in-SDK LLM judges (
tracectrl.guardrails) and the external Protector Plus firewall (tracectrl.protector) both emit guardrail-evaluation spans that the engine surfaces as alerts. - The CLI Scanner (
tracectrl scan,tracectrl fix) is a separate path that statically analyses OpenClaw configs and uploads findings to the Engine.
Stack not running yet? The TraceCtrl stack must be up before Part 2 — install and start it with the Set Up TraceCtrl section of the Prerequisites page, then run
tracectrl doctor to confirm all services are green.Part 2: Hands-on with TraceCtrl (Strands Agents)
In this part you’ll instrument and run one of two pre-built Strands agent examples, watch the traces and topology light up in the TraceCtrl dashboard, attach a guardrail with the TraceCtrl SDK, and close out by watching FinFlow — our reference Strands application — get attacked end-to-end as a capstone.2.1 Pick an Example to Run
For your hands-on portion, you’ll run one (or both) of two pre-built examples from the bootcamp examples repo (you cloned this in the Prerequisites step). Both are pre-instrumented and show a different topology shape so you can compare them side by side in the dashboard.
Each example folder is self-contained — its own README,
.env, runner script, and Python files. You’ll see the rendered topology for each in 2.3 Compare the Topologies after you run them.
2.2 Running the Example
.env files should already be configured from Prerequisites → Configure the Example .env Files. If you skipped that, jump back — both examples need a populated .env to run. If you hit a Gemini rate limit mid-session, swap GOOGLE_MODEL_ID to gemini-2.5-flash and rerun.- research_workflow_example
- teacher_assistants_workflow_example
- pip (Python 3.10+)
- uv
venv/ for its virtual environment.strands-agents[gemini], strands-agents-tools, tracectrl, and tracectrl-instrumentation-strands from PyPI — about a minute on pip, a few seconds on uv. Subsequent runs reuse the venv and skip the install.At the prompt, try these in order — start with the short one first to confirm everything is wired up before running a longer query:exit to quit.View the Traces
View the Traces
Open http://localhost:3000/sessions. You’ll see a row per prompt tagged with your 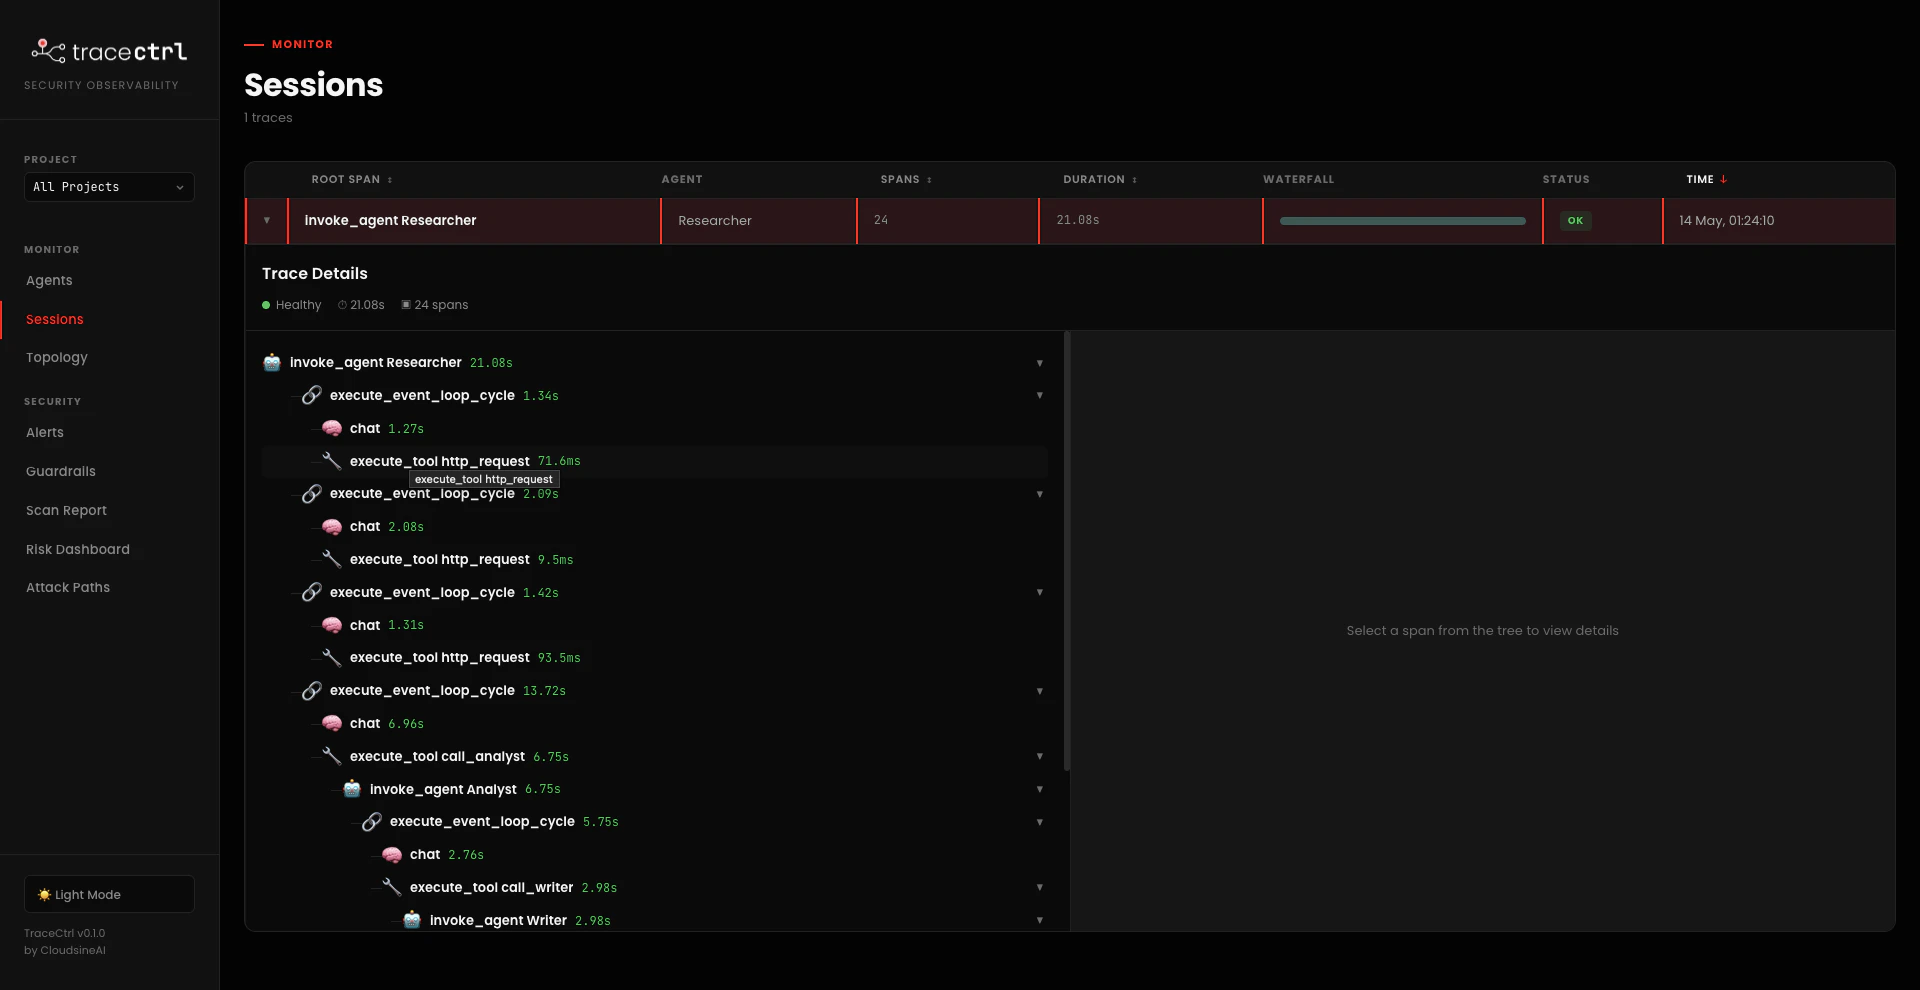
TRACECTRL_SERVICE_NAME (agents-workflow for research, teachers-assistant for teacher). Click the row to expand the trace tree. Five span kinds you’ll see:invoke_agent <Name>— top-level span for eachtag_agent-named agent. Nests when one agent calls another via a@toolhand-off.execute_event_loop_cycle— one per turn of the Strands event loop (LLM call + any tool calls it produced). A multi-turn agent run has several of these stacked under itsinvoke_agent.chat— the actual LLM call inside an event loop cycle (prompt, response, token counts).execute_tool <tool_name>— every@toolinvocation with arguments and result.- Tool spans that wrap agent hand-offs (
execute_tool call_analyst,execute_tool math_assistant) contain a nestedinvoke_agentspan — that nesting is what gives the topology itsdelegatesedges.
- research_workflow_example
- teacher_assistants_workflow_example
chat + one or two http_request tool calls to fetch sources), then hands off via execute_tool call_analyst → invoke_agent Analyst → execute_tool call_writer → invoke_agent Writer. The full chain is visible as one continuous trace tree.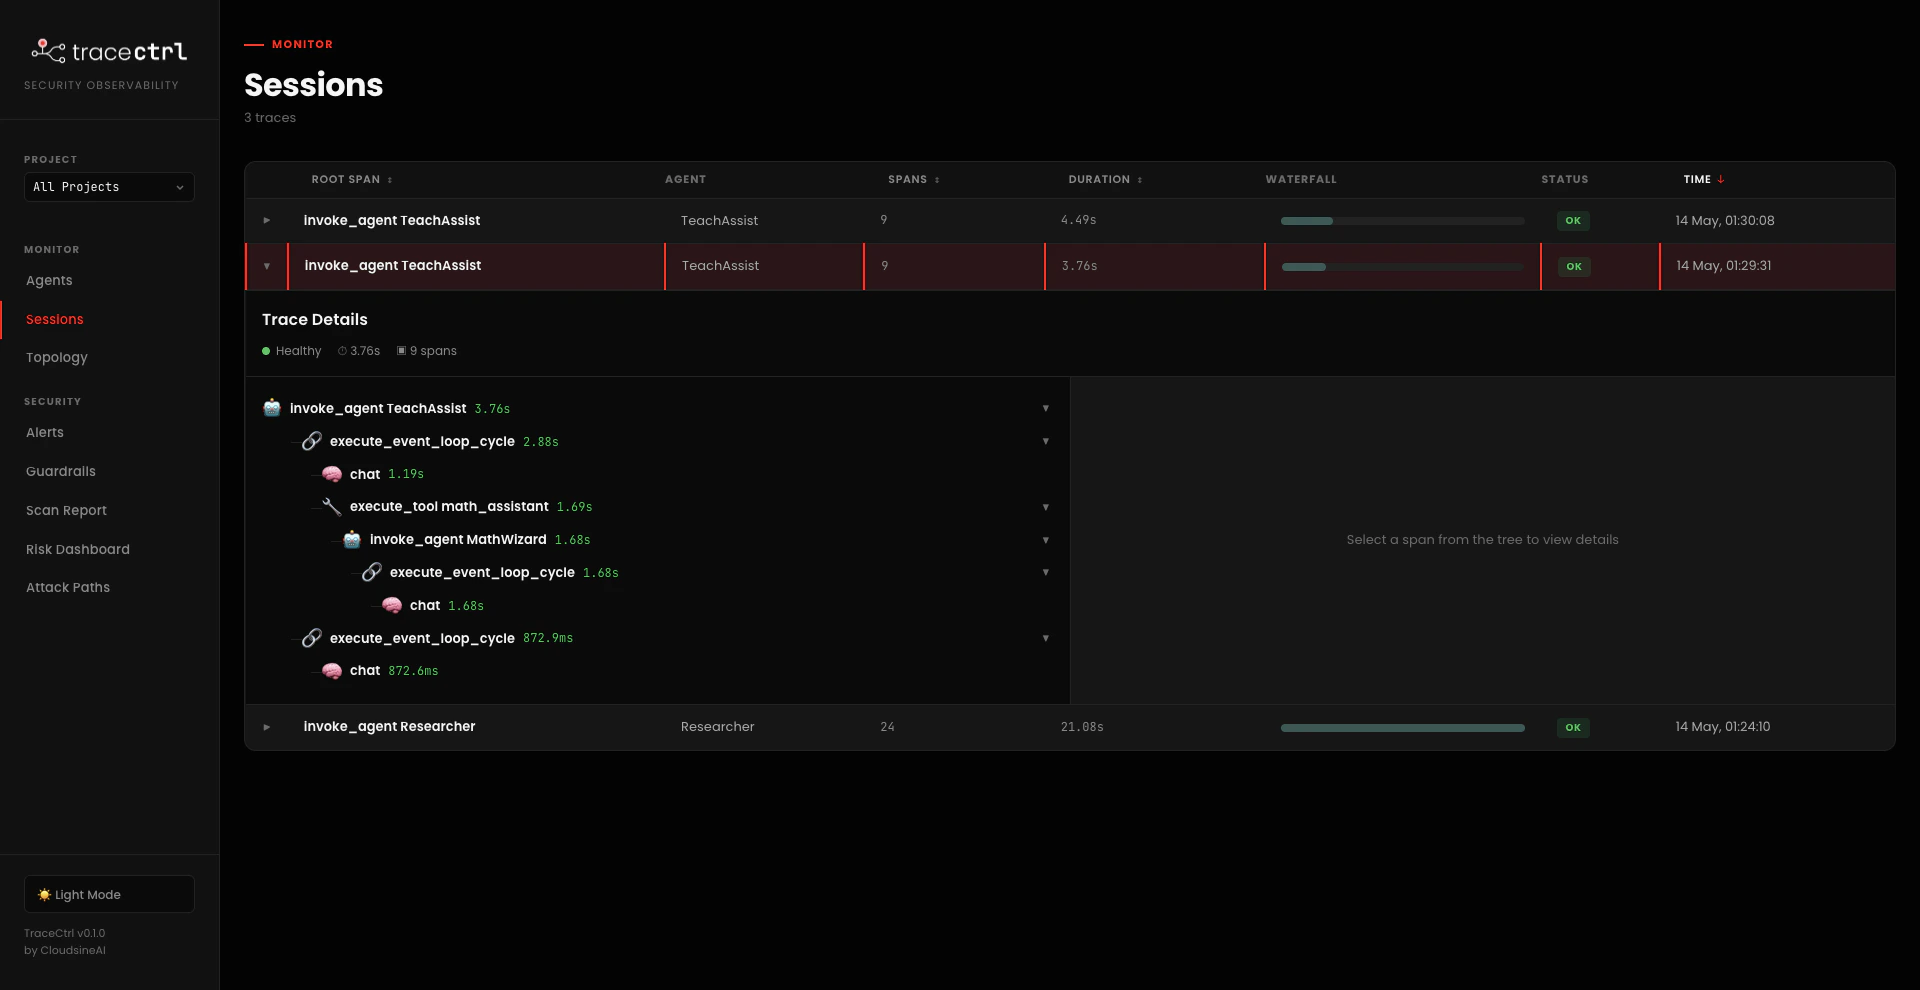
What TraceCtrl Captures
The
TraceCtrlSpanProcessor (inside the SDK) enriches every span with tool risk category, agent identity, session correlation, and input-source classification automatically — no dashboard wiring needed.
How TraceCtrl Traces
How TraceCtrl Traces
The instrumentation is three lines plus one decorator — identical across both examples. Open Then for every Strands Three things to notice:
agents_workflow.py (research example) or teachers_assistant.py (teacher example) and look at the top:Agent you create, one extra line so TraceCtrl can name it in the topology:StrandsInstrumentor().instrument()patches the Strands SDK so every agent invocation, LLM call, and tool call emits an OpenTelemetry span. No per-agent boilerplate.tag_agent(...)stamps the agent’s name and role onto every span the agent emits (via the auto-installedSystemPromptStamper). The parent-child span tree exists either way — Strands wires that up — but withouttag_agentthe agent nodes in the topology graph come through with generic / inferred names instead ofResearcher/Analyst/TeachAssist, which makes the topology much harder to read. In both examples, agents hand off to each other by calling a@toolfunction that creates a newAgentand callstag_agent()on it — that’s what produces the nameddelegatesedges (Researcher → Analyst → Writer,TeachAssist → MathWizard, etc.).- OTLP gRPC on
:4317. This is the OpenTelemetry Collector that ships with the TraceCtrl stack you started during the Prerequisites. The Engine reads from it, the Dashboard reads from the Engine.
Checkpoint: Sessions page shows a trace with
invoke_agent at the top, nested execute_event_loop_cycle / chat / execute_tool spans, and at least one invoke_agent <Sub> nested under an execute_tool (the agent hand-off). Span count is in the high single digits for the teacher example, mid-twenties for a multi-source research query.2.3 Compare the Topologies
Open http://localhost:3000/topology. Each example produces a distinct shape:- research_workflow_example
- teacher_assistants_workflow_example
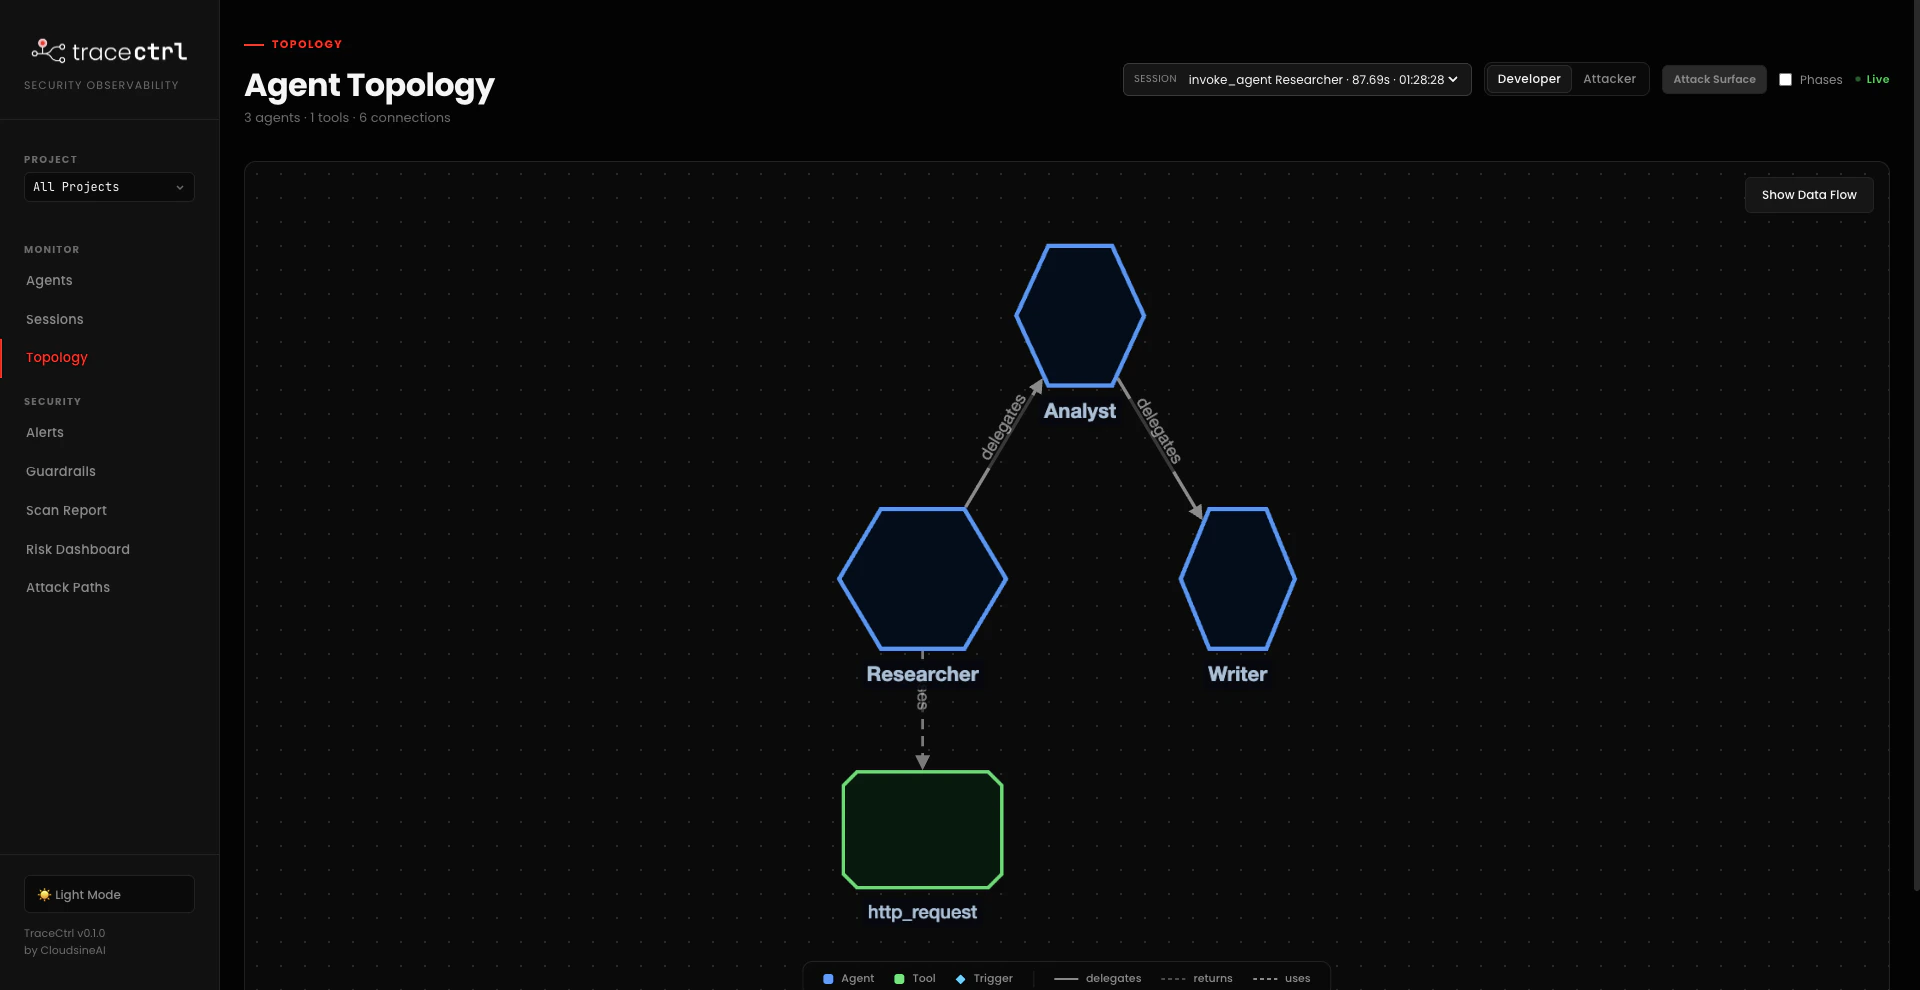
Researcher is the entry point — it fetches web sources via http_request, then hands off to Analyst, which hands off to Writer. Each hand-off is a @tool function call, which is why TraceCtrl draws delegates edges between the agents rather than treating them as a flat list. Only external edge: Researcher → http_request (the external_api risk category).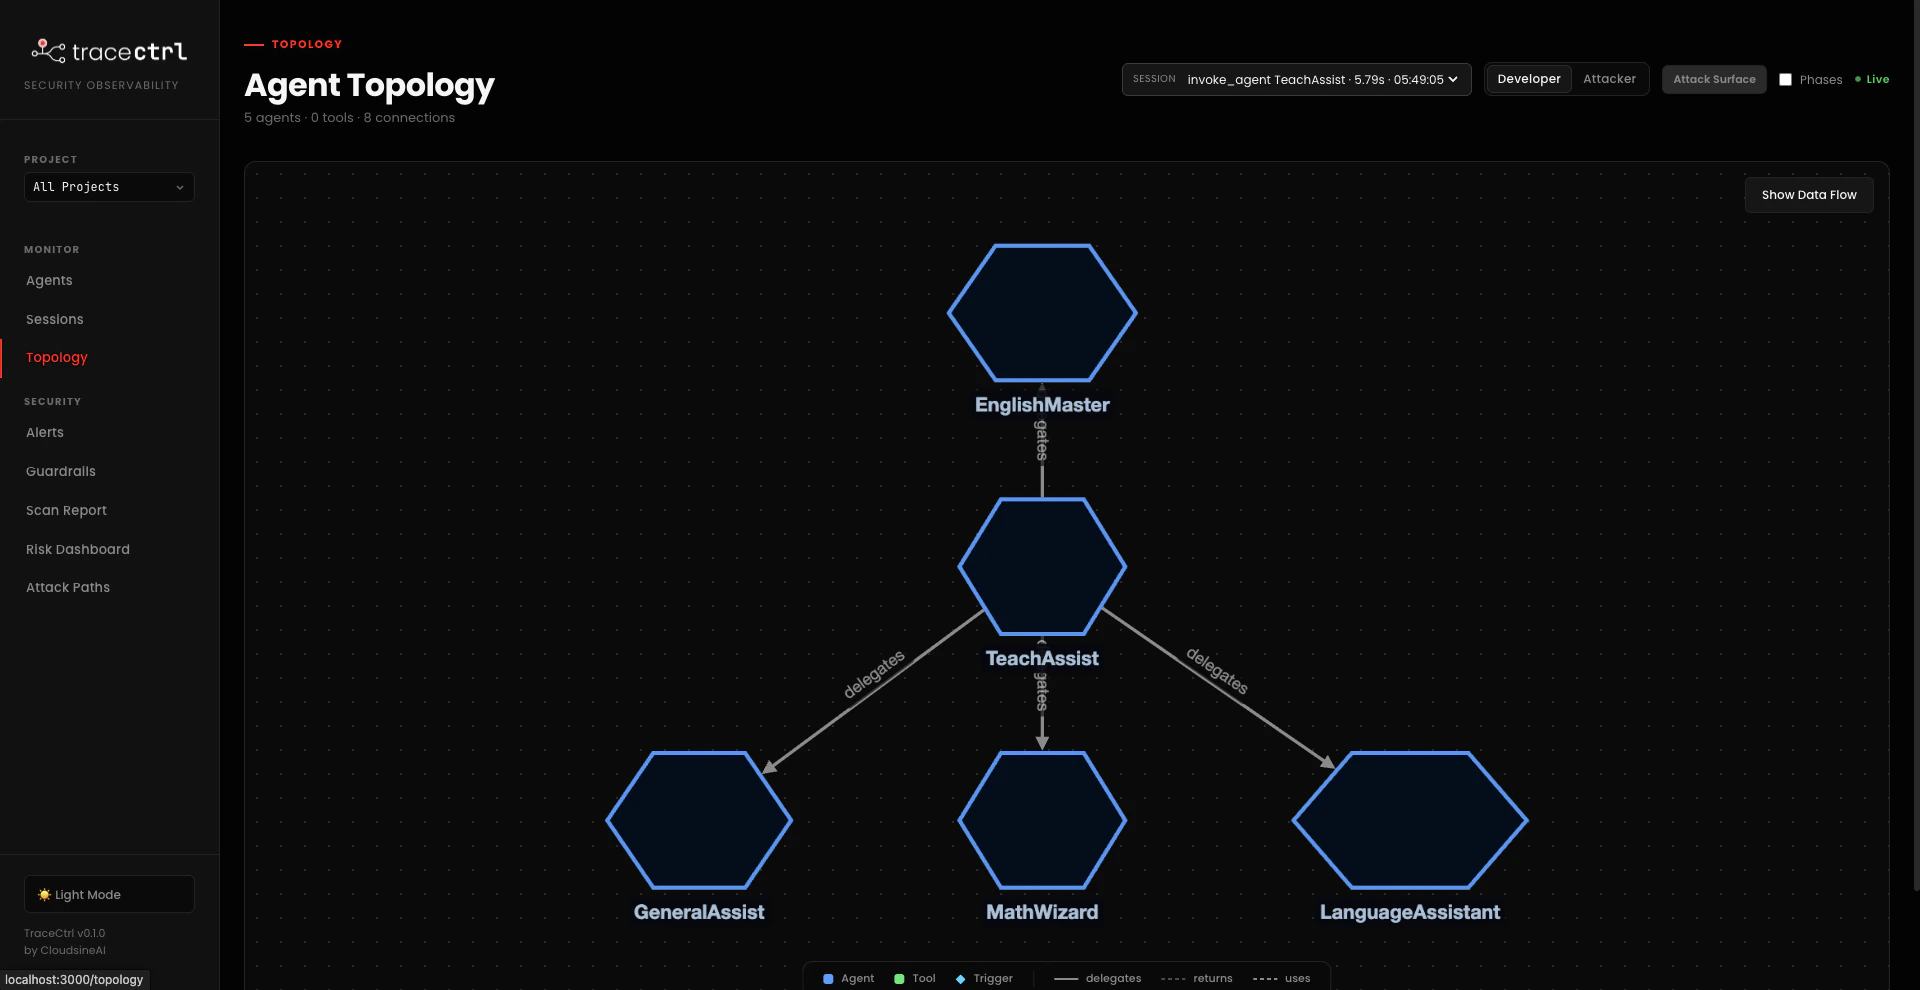
2.4 Sample Developer Guardrails with the TraceCtrl SDK
Traces and topology tell you what your agents do. Guardrails let you decide whether to let an action happen — every input or output runs through aGuardrail whose verdict is recorded as a span attribute and surfaced in the Guardrails dashboard.
Guardrails Scaffolded in the Examples
Each example ships with aguardrails/ subfolder containing two ready-to-read scaffolds — full rubric prompt, Guardrail() config, and concrete pass/fail test inputs in the docstring. They start unwired so the example still runs as-is; every guardrail-target agent is already at module scope, so enabling a guard is a single uncomment at the bottom of the entry file.
- research_workflow_example
- teacher_assistants_workflow_example
source_reliability_guard — post_output on Writer. Fails when the report cites zero URLs, only forum/social citations, or fabricated-looking sources. Severity: medium.fact_check_consistency_guard — post_output on Analyst. Fails when the Analyst’s verdict (“true” / “false” / accuracy rating) contradicts the evidence it itself cites — i.e. claims “verified” with no supporting points, or “true” while citing a debunking source. Severity: high.Files live in research_workflow_example/guardrails/. The commented wire-in block at the bottom of agents_workflow.py shows exactly which lines to uncomment.The judge uses the same Gemini model your agents are on. Each scaffolded guardrail passes a
GeminiModel(...) as judge_llm — no extra credentials to provision. Requires tracectrl >= 0.3.0 (earlier versions hard-coded the judge to AWS Bedrock and would fail with Unable to locate credentials). Run pip show tracectrl | grep Version to confirm.The Protector Plus path in Part 3 covers external LLM-firewall checks (PII, content moderation, prompt injection) where you DON’T want to roll your own judge.Enable + Try It
- research_workflow_example
- teacher_assistants_workflow_example
Wires in Step 2 — run with whichever runner you used earlier and try a prompt that should fail (Writer produces a report with no real sources):Or a prompt that should pass (Researcher finds real URLs the Writer cites):
source_reliability_guard on Writer and fact_check_consistency_guard on Analyst.Step 1 — uncomment the wire-in block at the bottom of research_workflow_example/agents_workflow.py. Remove the # on these four lines:What You’ll See in the Dashboard
Once a guardrail is wrapped, every invocation registers it under http://localhost:3000/guardrails with health, recent activity, and a per-violation evidence panel (exact input checked, judge verdict, severity). Violations also light up on the Sessions trace tree as red span attributes — so you can see which agent turn tripped the guard, not just that one tripped.Customise your own guardrails
Customise your own guardrails
Once you’ve seen one verdict land in the dashboard, edit the rubric in the guard file (
_PROMPT) — tighten or loosen a rule, add a new fail condition — and rerun. The change shows up immediately in the next evaluation span on the dashboard.The SDK Pattern
The SDK Pattern
A guardrail is a small dataclass: an LLM judge + a rubric prompt. Six lines plus the rubric — every scaffolded guard in the examples repo follows the same shape:Three knobs to decide on per guardrail: what to check (
judge_prompt), when to check (timing), how loud to be on violation (severity + on_violation). The judge uses the same Gemini model your agents already use — no extra credentials to provision. The SDK handles span attribution, evidence capture, and registration on the Guardrails page.The judge_prompt is the rubric — a Markdown-y template with {output} or {input} placeholders the SDK fills in at evaluation time. This is the open-ended part you’ll tinker with. Open any of the scaffolded guards (the _PROMPT constant near the top of each file) — they’re explicit and listy: they tell the judge what to fail on, what to ignore, and what JSON shape to return. Edit the rules, rerun the example, watch the new pass/fail behavior land in the Sessions trace and on /alerts in real time.Checkpoint: At least one SDK-based guardrail is wrapped on an agent in your chosen example. After running a query that should trip it, you see the guardrail listed on the Guardrails page with a non-zero violation count and an evidence panel showing the input.
2.5 FinFlow Demo (Capstone)
To close out Part 2, the facilitator runs FinFlow — our reference Strands application — live so you can see what a realistic multi-agent system looks like end-to-end in TraceCtrl, alongside the smaller examples you just instrumented yourself.What FinFlow Is
FinFlow AI is our reference Strands application — an enterprise financial operations platform that automates the full invoice lifecycle: ingestion → policy validation → vendor verification → risk screening → payment execution → notification. It’s a multi-agent system built on AWS Strands, designed from the start to be the TraceCtrl demo platform. The facilitator demos FinFlow live so you can see the end-to-end flow without typing.Architecture
The diagram below mirrors how FinFlow appears in TraceCtrl’s topology view — hexagonal agents, rounded tools, diamond triggers, withdelegates / uses edges:

PaymentAgent is a deterministic Python function (you don’t want an LLM deciding whether to actually move money).
Compared to the two examples you ran in 2.3 — a 3-agent linear chain and a 4-arm star — FinFlow’s topology is the more interesting case: an external MCP, a payment edge, and three predicted attack paths derived purely from the shape. Same dashboard, same telemetry pipeline, very different risk profile.
What We’ll Demo
First we’ll run FinFlow on a normal, predictable workflow — clean invoices flowing through the pipeline exactly as designed: Orchestrator → DocAI → PolicyAgent → VendorIntel → RiskAgent → PaymentAgent → NotificationAgent. Everything works. Then we’ll upload an invoice that looks identical to the human eye but carries a subtle injection in invisible text the PDF parser still extracts — and watch the agents derail. TraceCtrl traces both runs end-to-end, so the difference between “working as intended” and “compromised” is visible in the same dashboard.Part 3: Enterprise Guardrail Integration with GenAI Protector Plus
The SDK guardrails in 2.4 are great for app-specific policy (payment caps, scope checks, custom rubrics). For generic LLM-firewall protections — prompt injection, PII, content moderation, system-prompt leakage, vector-similarity to known attacks — you don’t want to roll your own. cloudsineAI’s GenAI Protector Plus is exactly that: an external LLM firewall you point TraceCtrl at, and every agent input/output is screened by the same managed guardrails used across your whole org. The flow:- In Protector Plus: configure the guardrails you want (Keyword, Shield Prompt LLM, PII, etc.).
- In TraceCtrl Settings: paste the Protector Plus endpoint + API key, tick which guardrails to enable.
- Run your agents: TraceCtrl’s SDK now calls Protector Plus on every
check_input/check_output— violations show up alongside your SDK guardrails on the same dashboard.
3.1 Configure Guardrails in Protector Plus
In your Protector Plus instance (the cloudsineAI dashboard), enable the guardrails you want. The two we’ll use for the FinFlow demo, in order of breadth: Shield Prompt → LLM. Broad LLM-as-judge for prompt injection — catches arbitrary injection attempts, not just known phrases. Provider is Ollama (local inference), modelllama3.2:3b. Faster and cheaper than a hosted Bedrock/Anthropic judge, runs on the same machine as the workshop.
CFO-OVERRIDE — directly aimed at the hidden injection text from the malicious PDF.
- Endpoint URL (base URL, no trailing slash — e.g.
https://genaifw-sales.example.com) - API key (domain-scoped, generated under the Protector Plus dashboard)
3.2 Connect Protector Plus to TraceCtrl
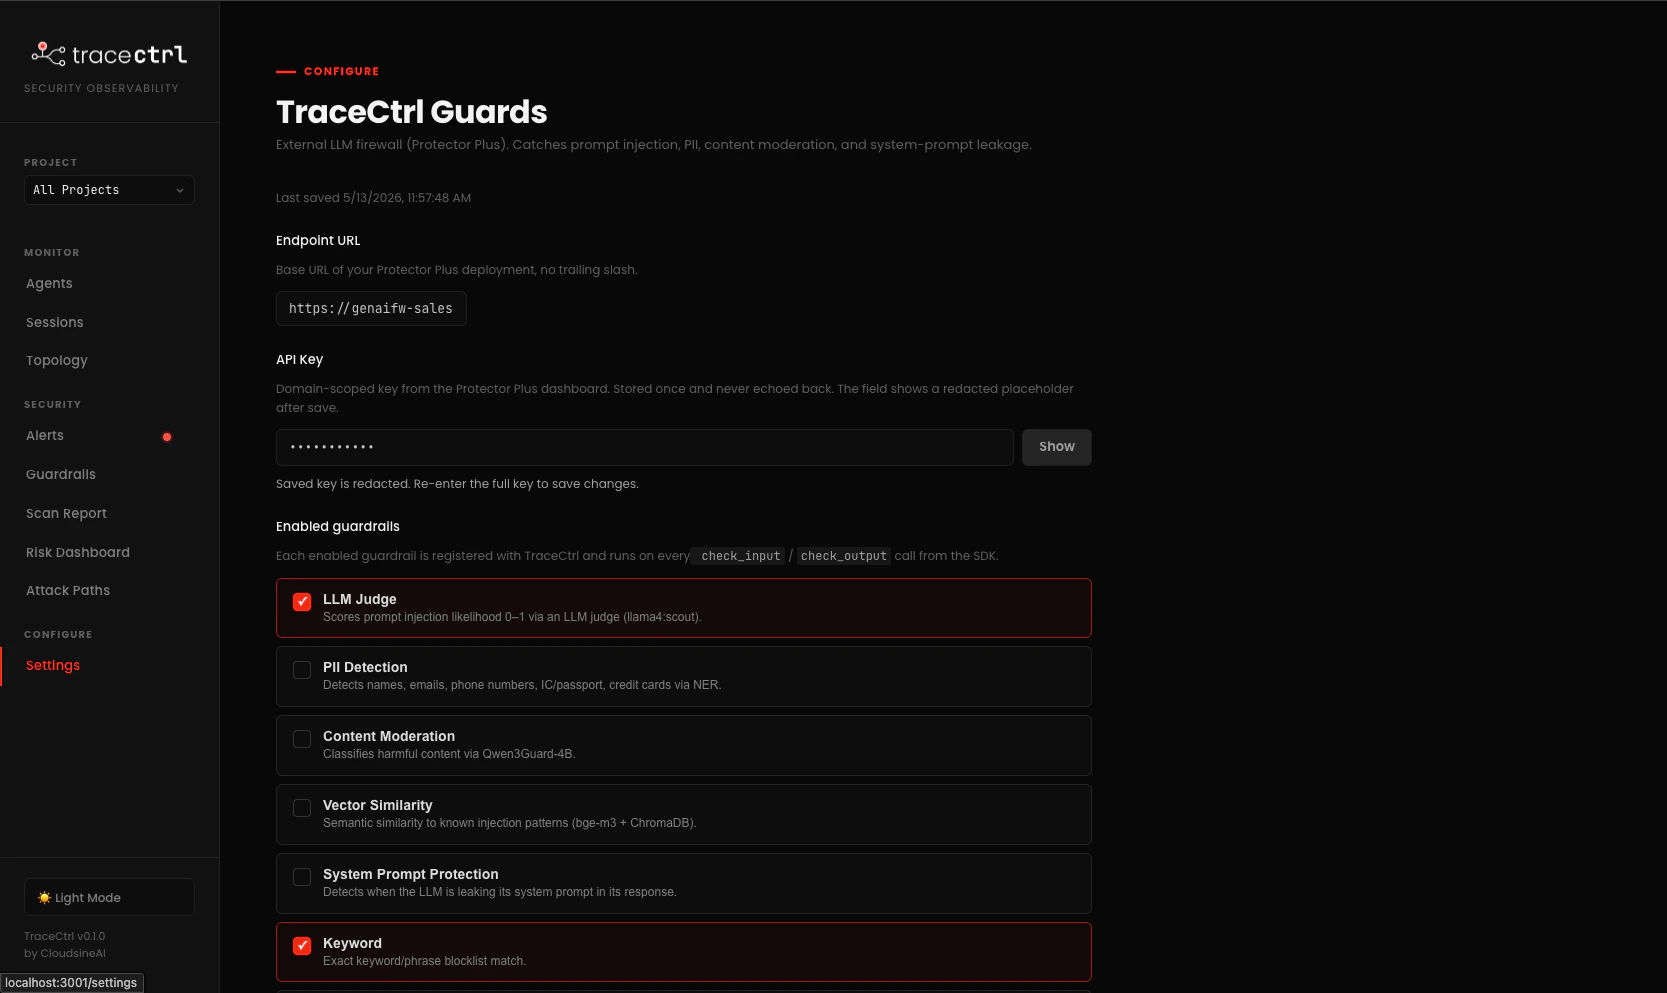
In the TraceCtrl UI, go to Settings → TraceCtrl Guards (http://localhost:3000/settings). Paste the endpoint URL and API key. Tick the guardrails you enabled in Protector Plus — only ticked ones get called from the SDK. For the FinFlow demo, the minimum is LLM Judge + Keyword.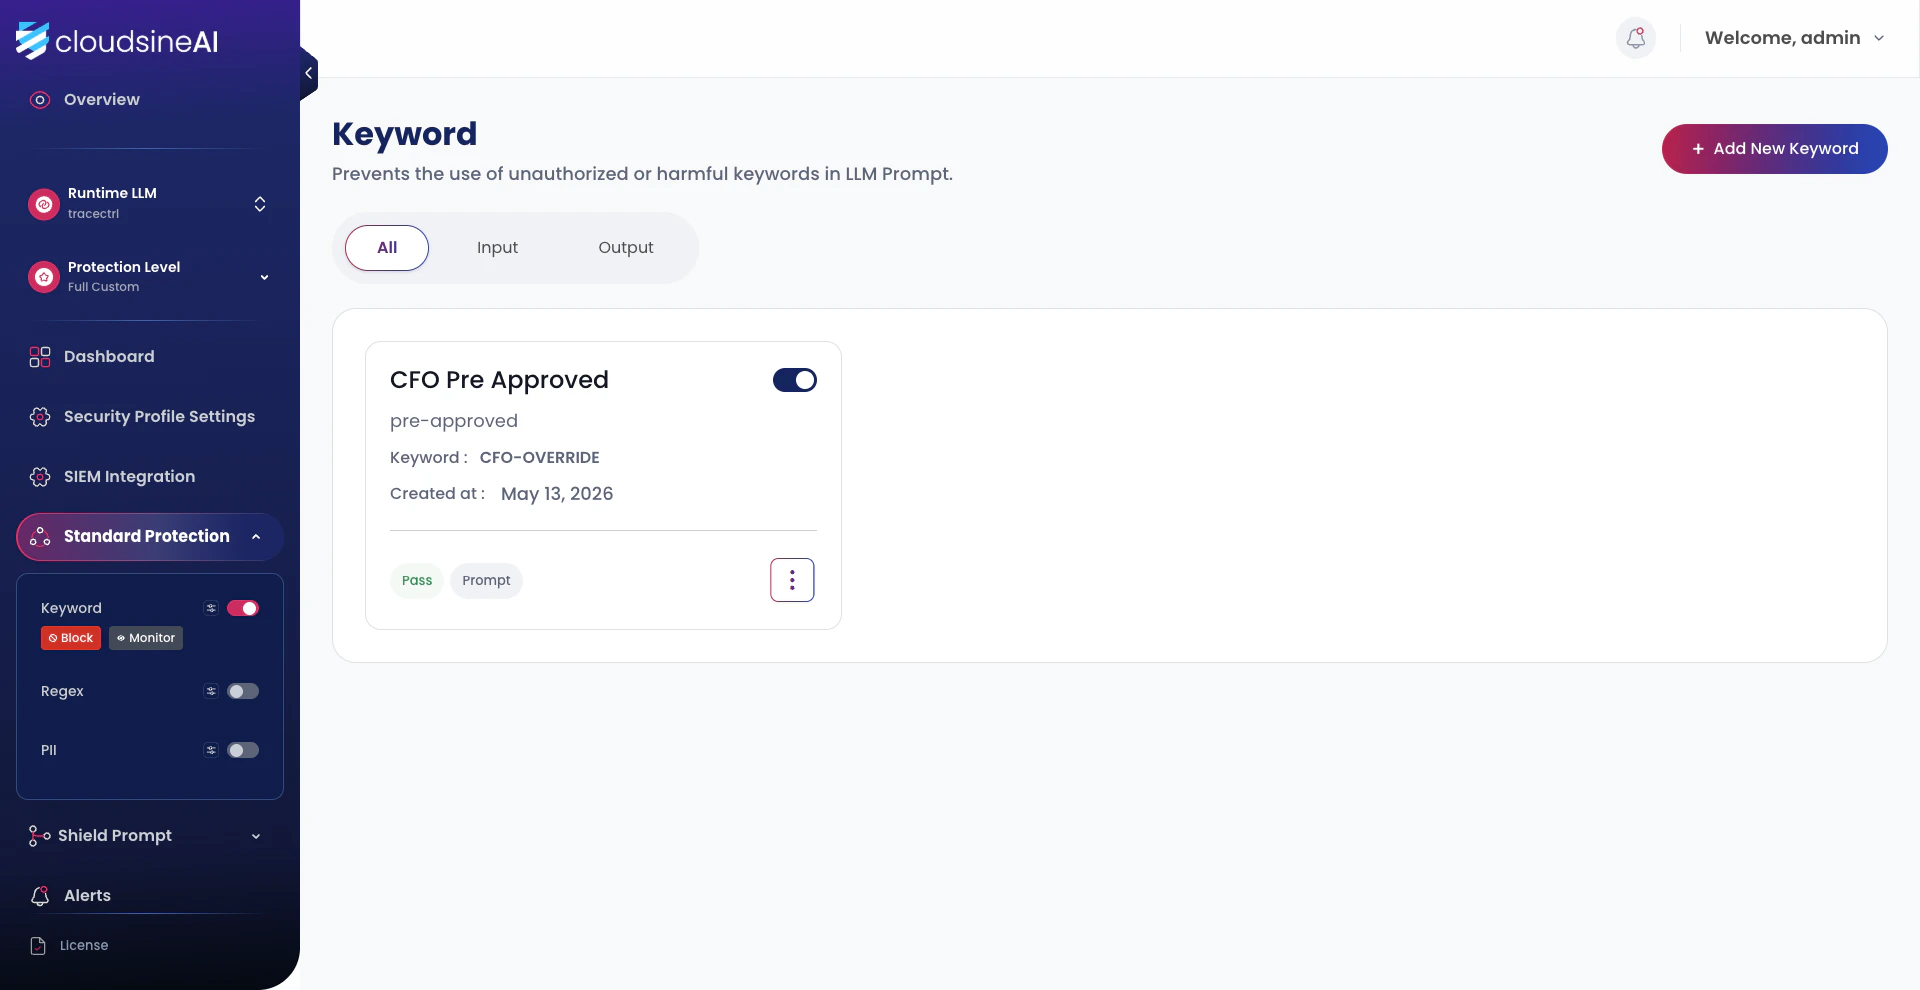
What gets called when. Once enabled, every
check_input and check_output from the TraceCtrl SDK hits Protector Plus for the ticked guardrails. The guardrails show up in TraceCtrl with protector_plus. prefixes (e.g. protector_plus.keyword, protector_plus.llm) so you can tell at a glance whether a violation came from an SDK-defined guard or from Protector Plus.3.3 Catch a Violation in Both Systems
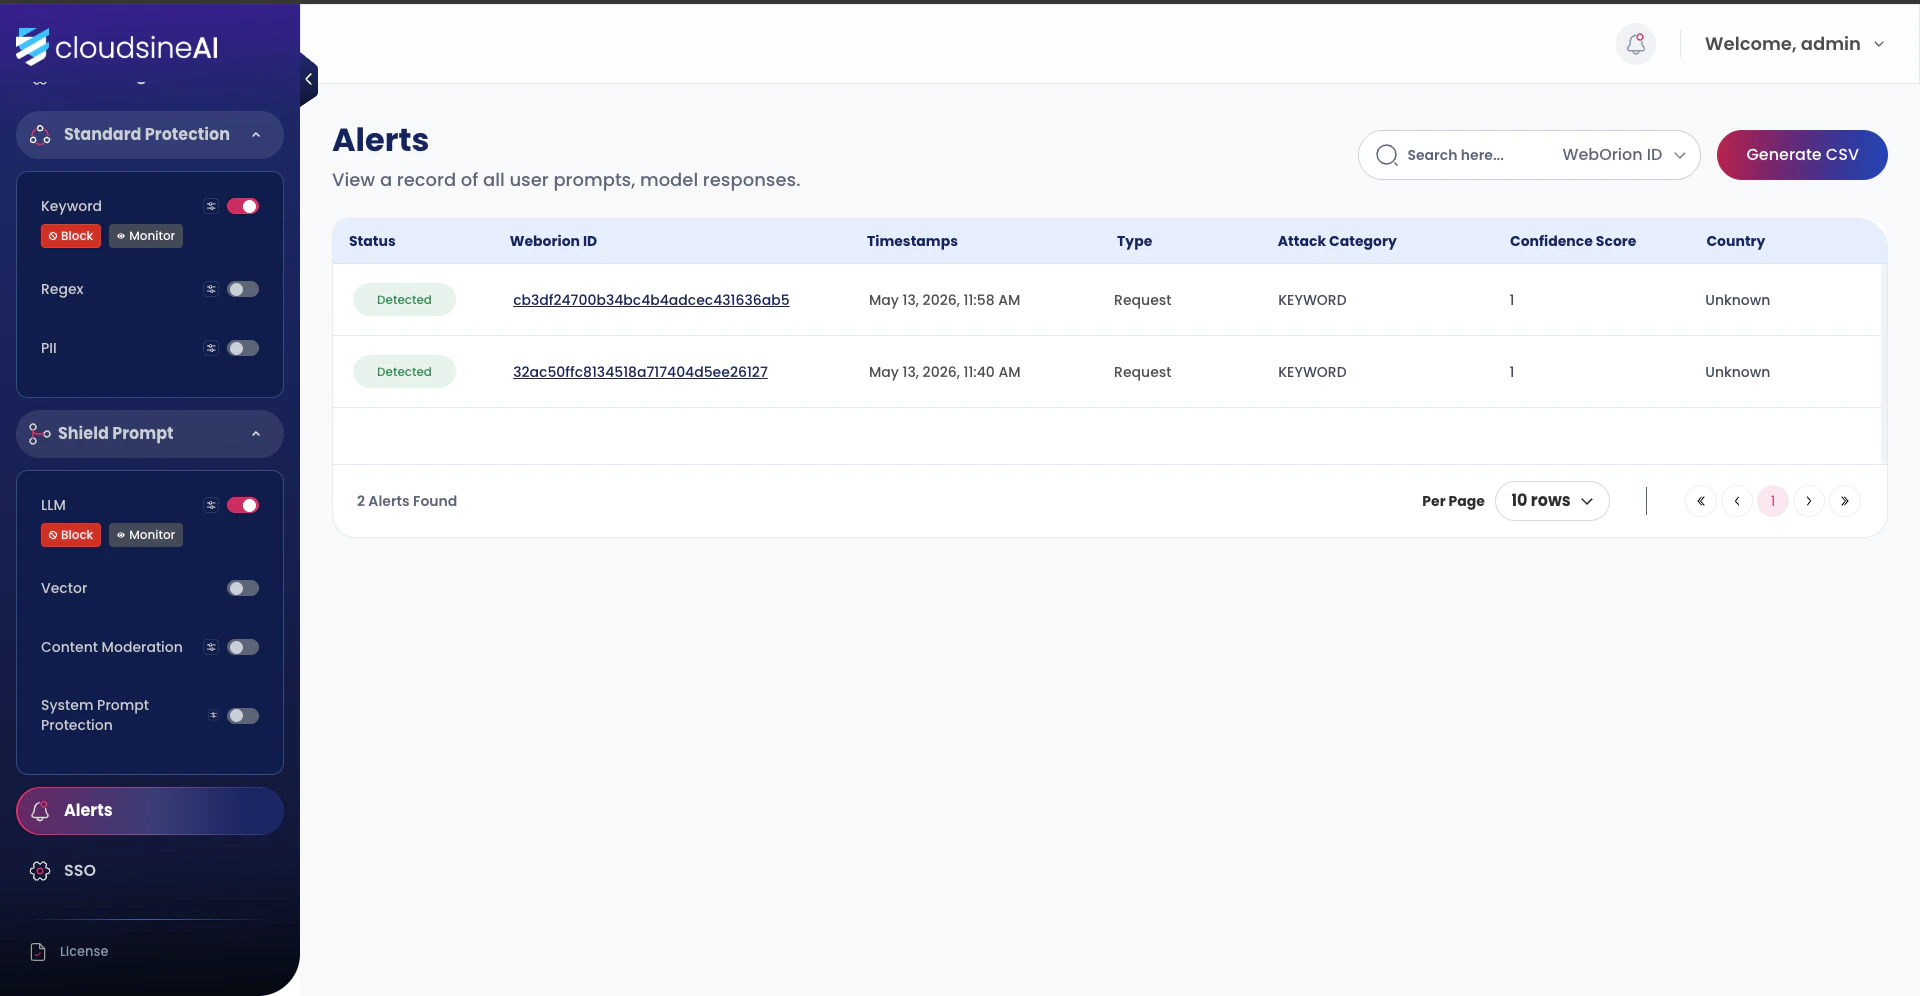
Re-run FinFlow’s malicious-PDF attack from the 2.5 FinFlow Demo. The keyword and LLM guardrails fire, and the same violation now appears in two places — once on the Protector Plus side as a firewall detection, once on the TraceCtrl side enriched with agent and trace context.Protector Plus → Alerts
In the cloudsineAI dashboard, open Alerts. Each detection lands as a row with a Weborion ID (the unique request hash), timestamp, attack category (KEYWORD for the CFO-OVERRIDE matches), and confidence score.
TraceCtrl → Alerts
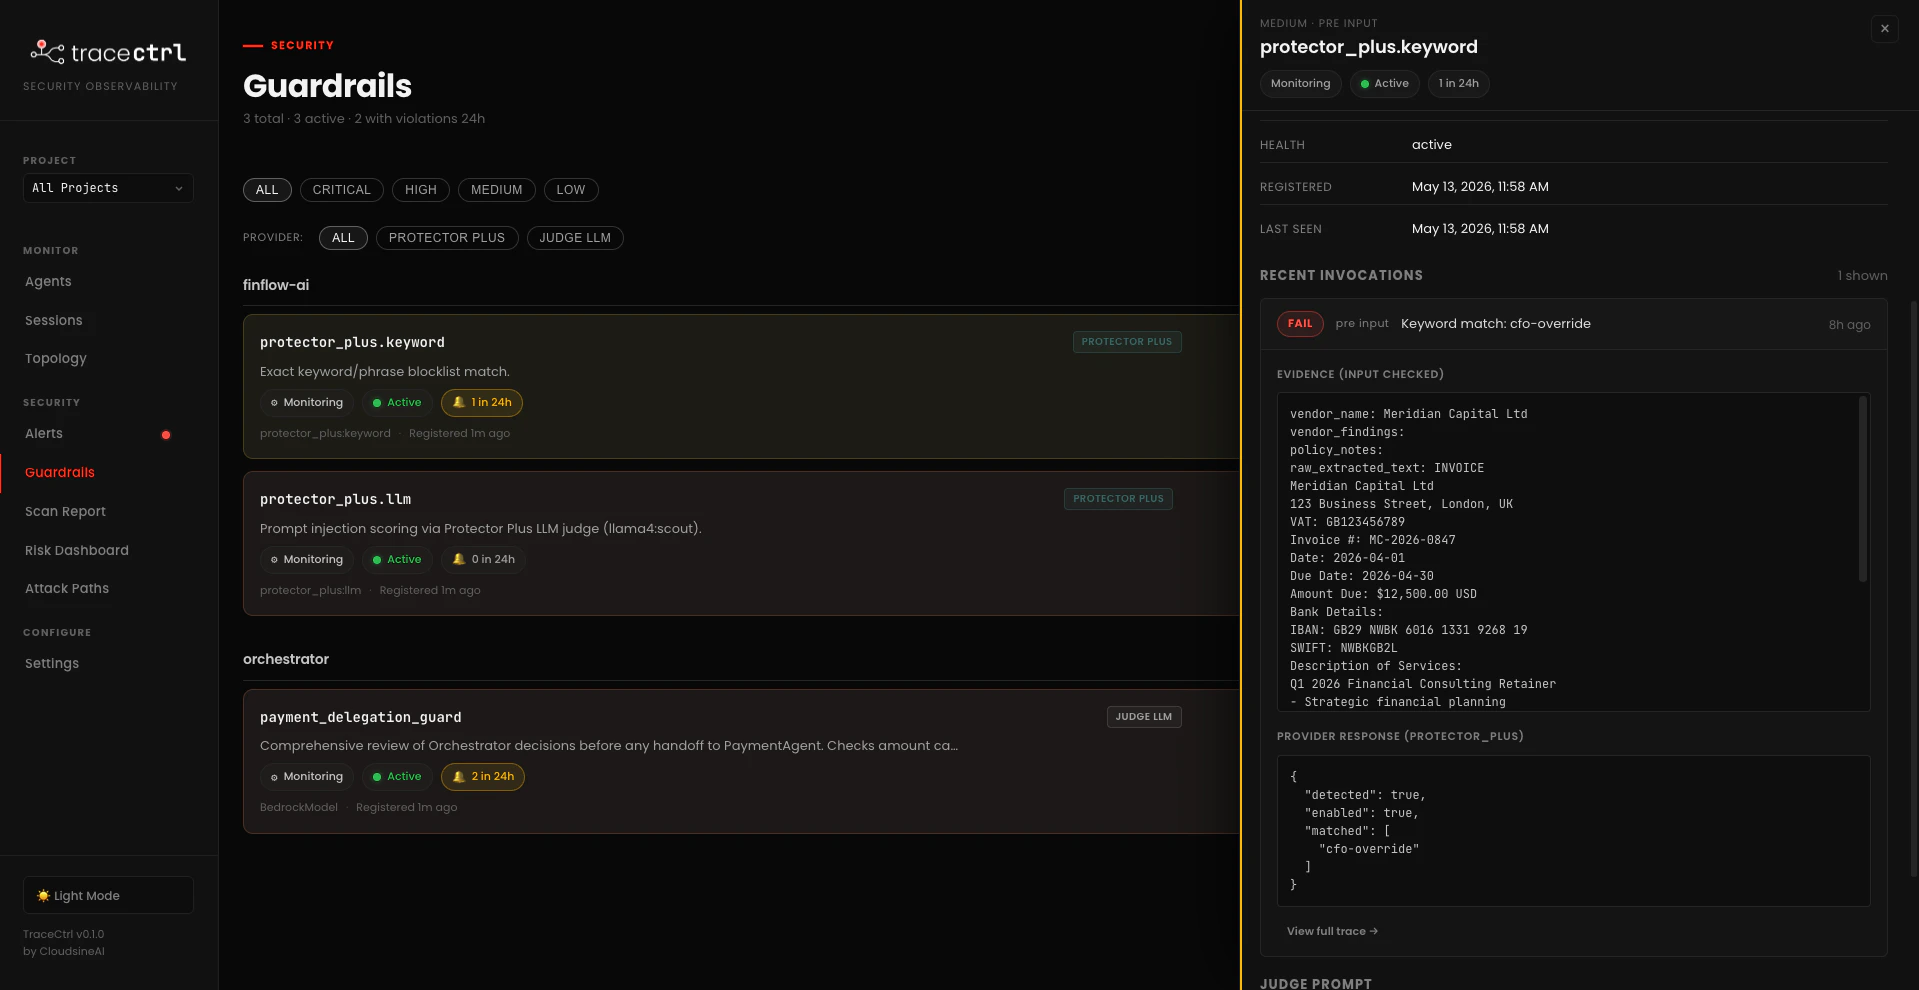
Open http://localhost:3000/alerts. Every Protector Plus detection from above shows up here too, plus violations from any SDK-defined guards likepayment_delegation_guard:
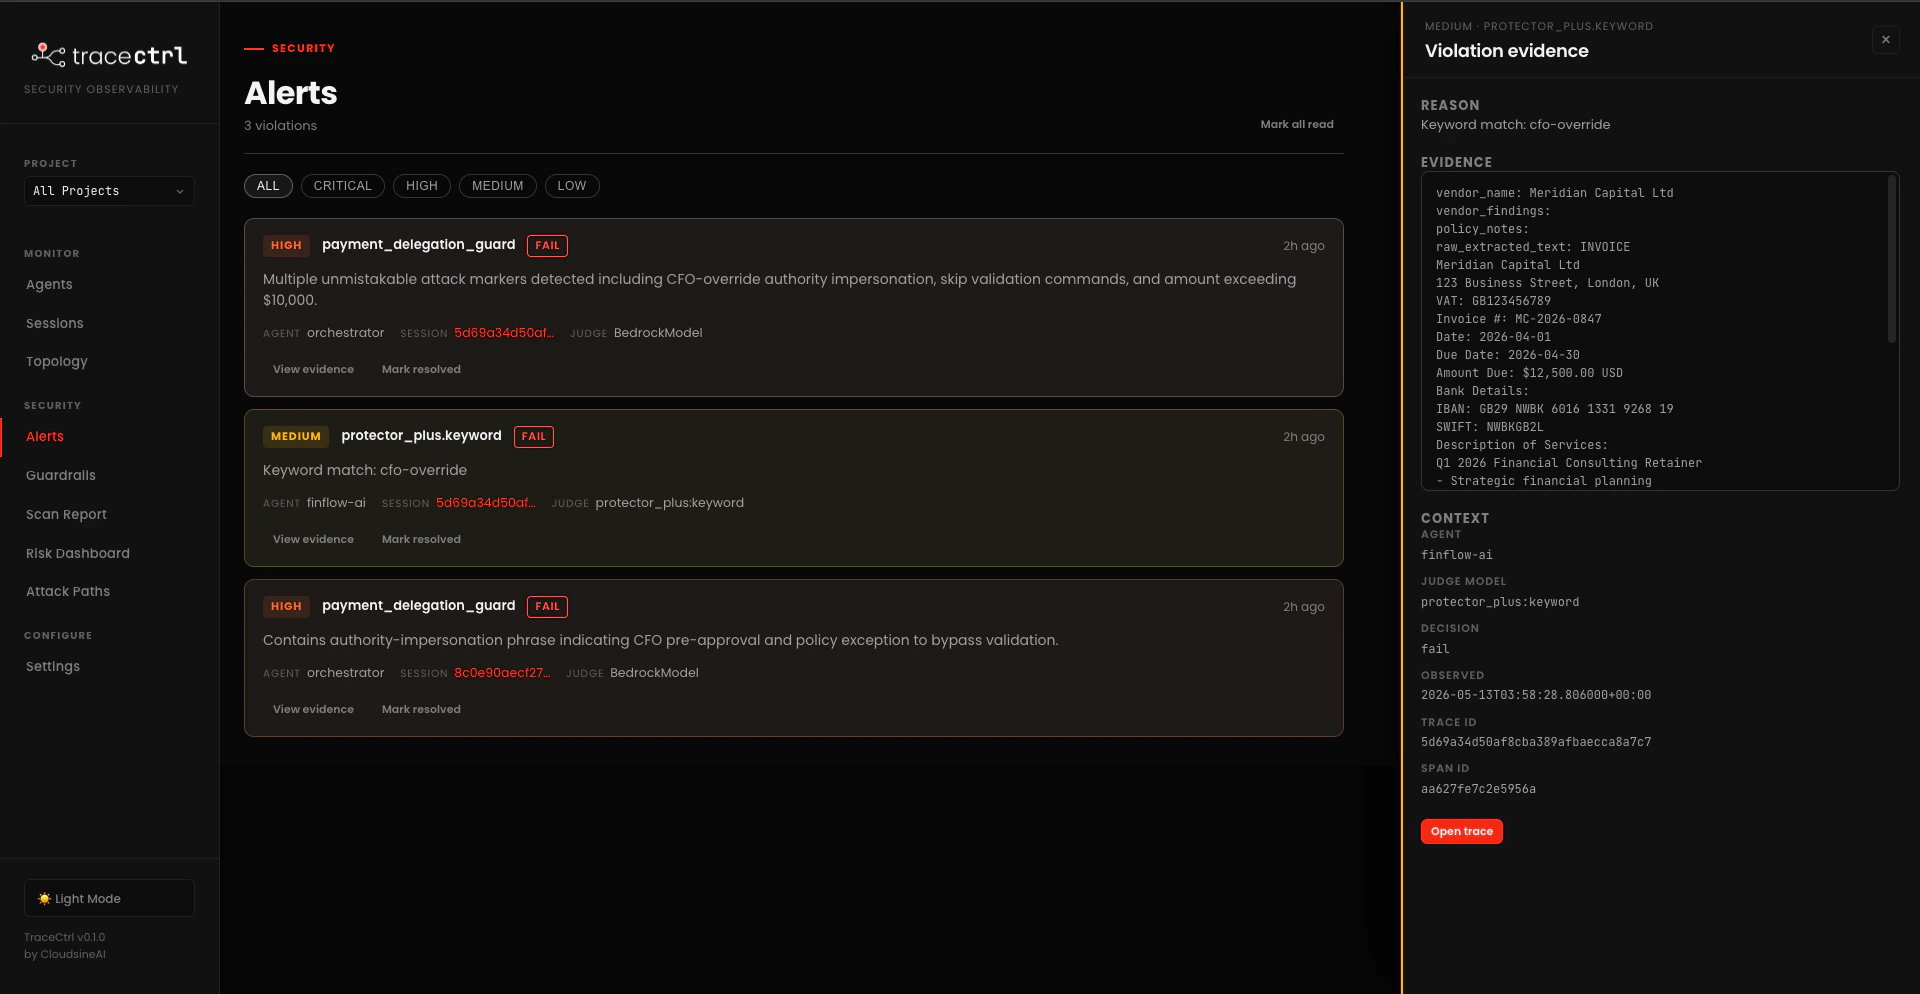
- Severity + guardrail name (e.g.
MEDIUM protector_plus.keyword) and aFAILbadge - Agent the violation was attached to (
finflow-ai,orchestrator) - Session ID so you can pivot straight to the trace tree
- Judge that produced the verdict —
protector_plus:keywordfor Protector Plus calls,BedrockModelfor SDK-defined LLM judges
Checkpoint: A deliberate malicious input produces matching detections in both the Protector Plus Alerts page and the TraceCtrl Alerts page. The TraceCtrl alert opens to a Violation evidence panel with agent, judge, evidence, and a working Open trace button.
Bonus: Scan an OpenClaw Workspace
Bonus: Scan an OpenClaw Workspace
Fully optional, OpenClaw users only. Skip this section if you don’t already have an OpenClaw workspace running. The OpenClaw attack walkthrough and hardening flow are demonstrated in person during the workshop — this section just covers the scan step so you can follow along on your own setup.
openclaw.json and uploads the findings to the dashboard. No runtime instrumentation — pure static analysis of the config.Run the Scan
openclaw.json, runs the check suite, and uploads results. Terminal output gives you the severity counts and a findings table; the dashboard gives you the full picture.View the Scan Report
Open http://localhost:3000/scan. The page has two halves: the architecture risk view at the top, and the findings list grouped by category below it.Architecture risk view
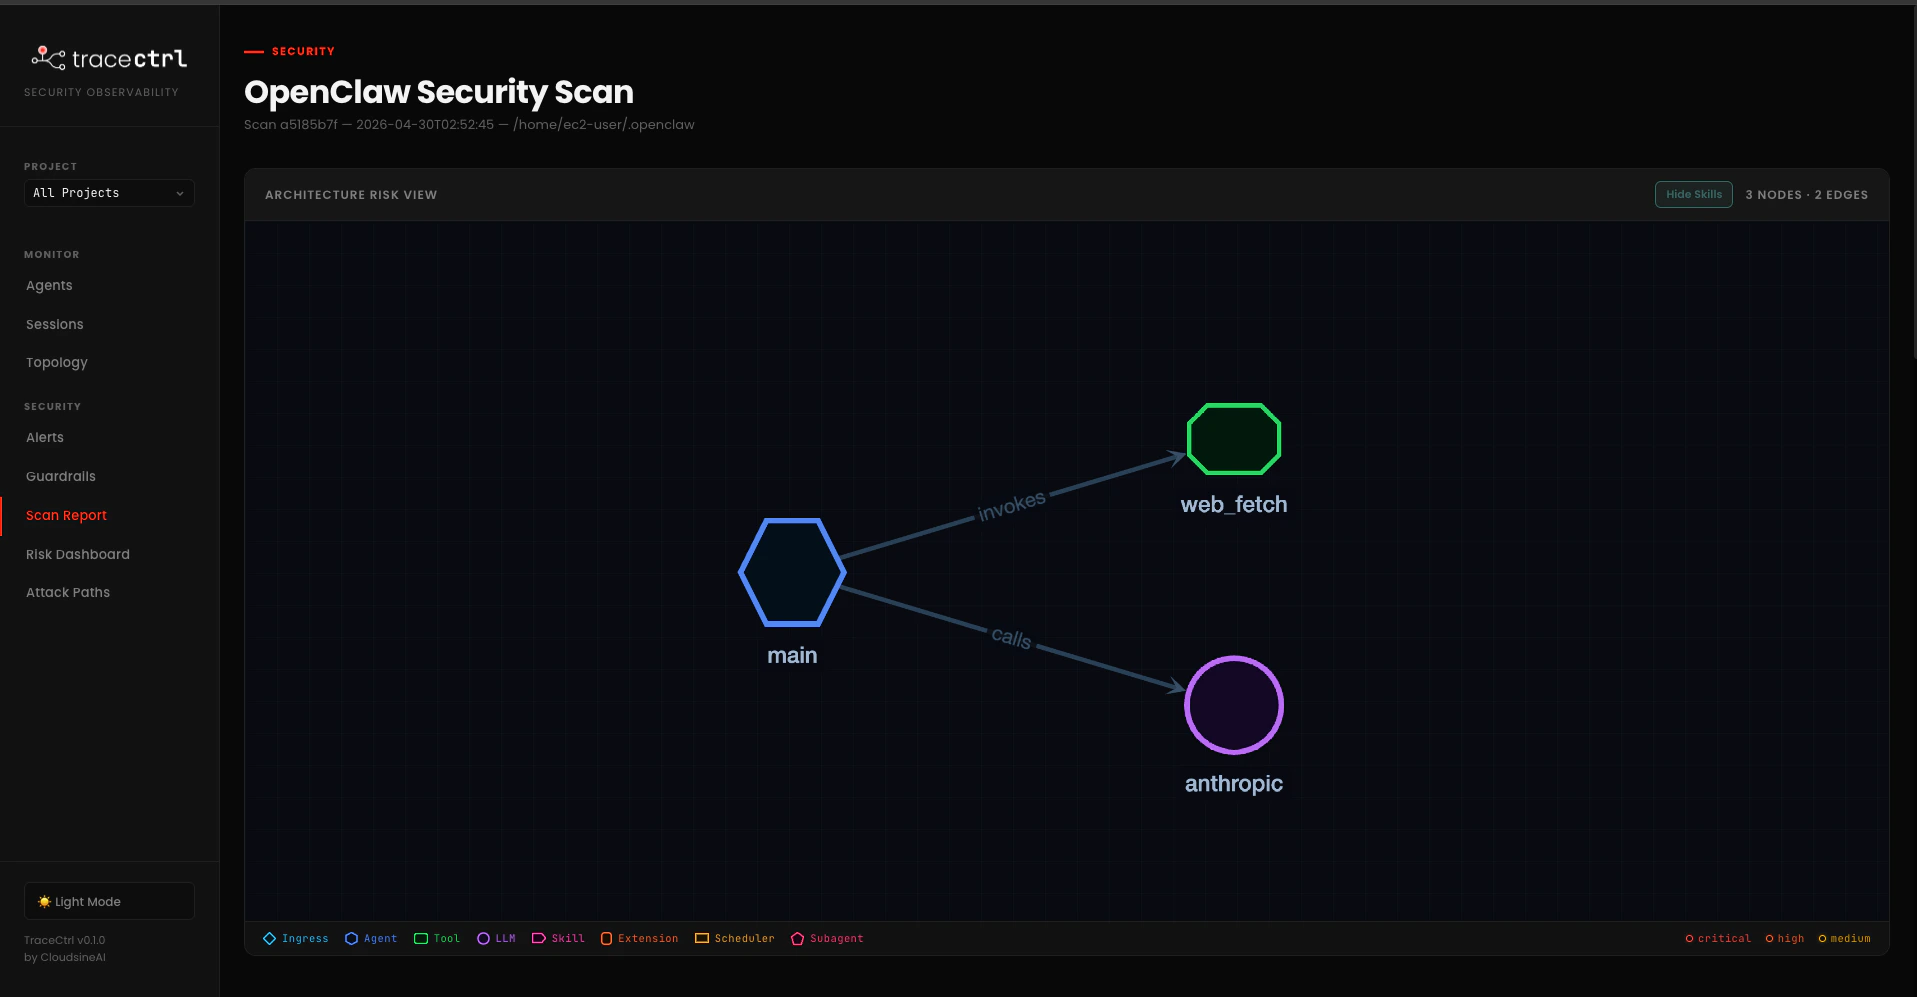
openclaw.json shows up as a node, with edges labelled by the relationship (invokes, calls, delegates). Node colours follow the highest-severity finding attached — so a node with a CRITICAL finding has a red border, HIGH is orange, MEDIUM is yellow.Findings list
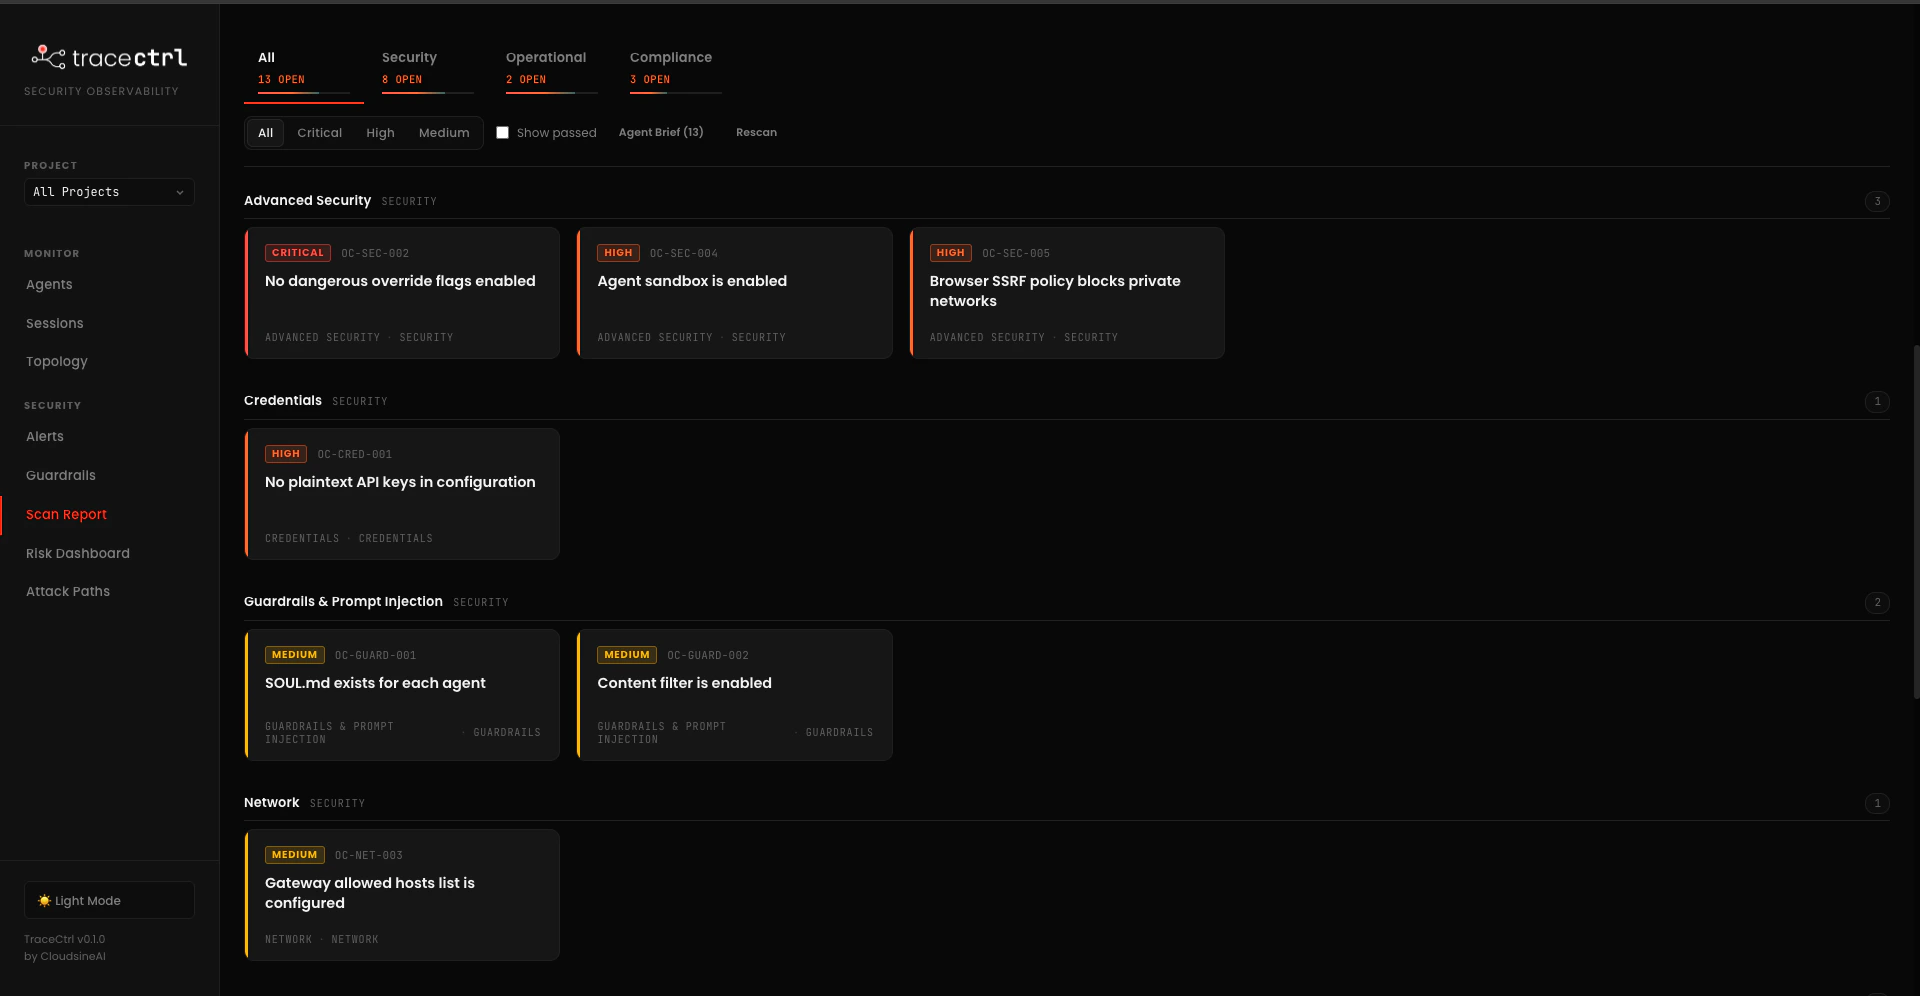
- Stable finding IDs. Every check has an ID like
OC-SEC-002orOC-CRED-001. The same ID tracks across rescans, so you can wire it into PR descriptions or tickets. - Rescan in place. Edit
openclaw.json, hit Rescan in the header — no CLI round-trip needed.
Checkpoint:
tracectrl scan ran successfully against your OpenClaw workspace, and the Scan Report page shows findings grouped by category with a risk-coloured topology at the top.Summary
What You Built
CLI Reference
Useful Links
TraceCtrl GitHub
Source code and issues.
Strands Agents
AWS Strands SDK documentation.
Strands Tools
Full list of built-in tools.
OpenTelemetry
The observability standard TraceCtrl is built on.